
The genes used in this study corresponded to the autosomal genes that were present in the ExAC database, build r0.3,1 and for which there was at least one rare synonymous and one rare non-synonymous variant. The inheritance mode for genes of the training set was inferred from various sources: hOMIM, a curated database for Mendelian diseases in humans;2 RetNet (https://sph.uth.edu/retnet/), listing all genes involved in inherited retinal conditions; the Nosology of genetic skeletal diseases;3 and the complete index of new disease genes for Mendelian disorders published from 2009 to 2015 in the American Journal of Human Genetics. To ensure quality, we manually curated all the sources by discarding (i) all genes linked to both AD and AR inheritance, (ii) genes directly linked to cancer, (iii) disease genes that were not reported in the literature in more than one pedigree without additional very strong molecular evidence, and (iv) genes associated with non-clinical phenotypes.
We extracted data relative to 47,800,457 variants from ExAC, build r0.3, filtered to be non-intronic and rare (MAF < 0.01). Then, they were classified as missense, synonymous, stop-gain, splice donor, splice acceptor or frameshift insertion/deletion. Missenses and synonymous variants were then annotated with PhyloP46way.placenta.4 All genes were annotated with the number of rare variants in ExAC, according to the type of changes. To take into account gene-specific mutational rates,5 the same features were divided by the number of synonymous variants, making in the end 11 features. We also extracted the number of heterozygotes and the number of homozygotes (for missenses, nonsenses, and synonymous), the SIFT6 and the PolyPhen7 scores (for missenses), as annotated in the ExAC dataset. The same was done for the PhyloP score. From these features, we computed the minimum, maximum, average and median scores for each gene, producing in the end 40 additional features. Furthermore, we annotated all genes with “functional gene constraints” from ExAC,8 namely synonymous, missense and loss-of-function (LoF) Z-scores and pLI (probability of being LoF intolerant), pRec (probablility to be intolerant of homozygous LoF variants) and pNull (probability of being tolerant to LoF variants). Since some of genes lack those values (mainly due to low coverage), we attributed to them Z-scores of 0 and probabilities of 0.5. At the end of this process, the total number of features related to DNA variants was 57.
We used BioMart9 from the Bioconductor package10 in the R programming language to extract the following functional features:
1. The number of transcripts per gene
2. The GC content per gene
3. The 50 most represented GO terms
4. The 50 most represented GOslim terms
5. All three GO domains per gene
6. The number of Interpro domains
7. The presence of at least one transmembrane domain for the encoded protein
8. The “Low complexity” tag
9. The presence of a signal peptide sequence
10. The presence of coiled coils
11. The length of 3’ and 5’ UTRs
12. The length of the coding sequence (CDS)
13. The number of paralogs (0, 1 or 2, for 2 or more paralogs)
14. The average, minimum and maximum of dN/dS with human paralogs
15. The average, minimum and maximum of percent identity with human paralogs
16. dN/dS between human and 67 different animals
The total number of functional features was 187.
We used the Gene Expression Database (GXD) from MGI11 to assess whether a gene was expressed up to embryonic day 15 (E15) in the mouse embryo or whether it was not expressed after E15 (using immunohistochemistry, in situ reporters, RT-PCR and western blot experiments), adding 2 new features.
We used PhyloP46way.vertebrate4 to obtain the conservation score for 5’UTR regions (-500 to +500bp from the TSS of each gene), which was identified as informative for haploinsufficient genes by Huang et al.12 We then computed how many of these 1,000 values were lower than -0.5, 0 or 0.5, higher that 1, 1.3, 1.6 or 1.9 and also the mean and the median values, adding 9 features.
We downloaded data from STRING v1013 to obtain interactions between genes and their relative confidence scores. We then computed, for each gene, the number of its interaction with AD genes of the training set, for the 8 different types of interaction present in the database, namely: neighborhood, gene fusion, co-occurence, co-expression, experiments, databases, textmining and combined score. For each type, we selected various confidence thresholds (150, 200, 250, 300, 350, 400, 450, 500 or 600) and various maximal numbers of interactions (3, 4, 5, 6, 7 or 8) to make 432 supplementary gene features.
We downloaded the list of p-values of the meta-analysis performed by Colombo et al.14 to identify NMD targets in the human genome. This dataset contains 9 p-values per gene linked to differential mRNA expression for knock-down, rescue or meta experiments, making 9 new features for our model. For genes with missing values, we set all p-values at 1.
We used data obtained from the experiments by Sharova et al.15 reporting the mRNA half-life for 19,977 genes, expressed in mouse embryonic stem cells. mRNA half-life was categorized into 4 classes (>10h, >15h, <3h or <5h), making 4 more features for our model.
In total, we obtained 700 features per gene, in addition to their inheritance mode (for the complete list, please refer to the Supplementary table S2 of the paper).
Features were preselected not to be constant in either AD or AR genes of the training set. Then a second filter was applied by taking only features which were significantly different between AD and AR genes of the training set (Wilcoxon signed-rank test, p<0.05, with Bonferroni correction). This allowed 308 features to enter in the LDA algorithm (Figure 1c of the paper).
The LDA model was composed of four steps:
1. For the first iteration: go to step 3. For the following iterations, test the individual removal of each feature of the previous model and remove it only if the AUC (Area Under the Curve) is decreasing by less than 0.0005. If so, go to step 4.
2. Test the individual replacement of each feature from the previous model with each feature not present in the previous model, from the pool of 308 pre-selected features. If the AUC is increasing, keep the change and go to step 4.
3. Add the non-selected feature that increases the most the AUC.
4. Compute the average AUC for training, testing and validation sets in 10x 10-fold cross-validation and retain the model. Go back to step 1.
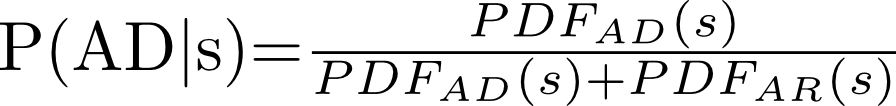
We approximated the distributions of scores for AD and AR genes with normal distributions by taking the average and the standard deviation of the scores (Figure 2a of the paper). More specifically, given a gene with score s, we computed its probability of being associated with dominant conditions (P(AD)) as the ratio between the probability density function (PDF) for AD genes divided by the sum of both AD and AR genes’ PDFs:
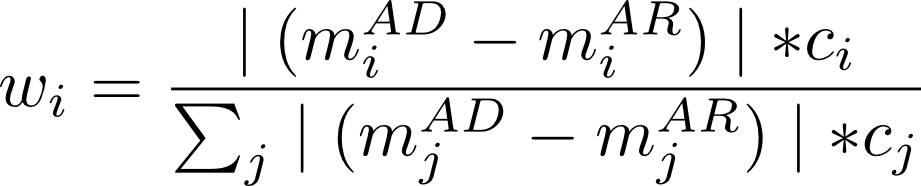
The weight for each feature was computed with the following formula (m=mean, ci=LDA coefficient for the ith feature of the pool of j selected features):
We downloaded denovo-db v1.5 (http://denovo-db.gs.washington.edu/denovo-db/Download.jsp) and extracted variants related to intellectual disability or epilepsy from exomes or genomes. We filtered them to have an impact on protein or expression (missense, nonsense, frameshift or splicing) and to be never seen in ExAC and ESP databases (see Web Resources) and selected genes with mutations present in at least two individuals with the same disease. We performed a hypergeometric test to assess if the ratio of genes with P(AD) ≥ 0.95 (h) over genes with P(AD) < 0.95 (l) was significantly higher in selected genes for intellectual disability or epilepsy compared to all autosomal human genes with an available P(AD) (H for ≥ 0.95 and L for < 0.95). We defined the enrichment factor as (h/l) / (H/L).
RStudio (www.rstudio.com) version 0.99.893 was used for computational analysis and graphics with R version 3.3.2 (2016-10-31). The packages pROC16 and bioMart17 were also used.